Measuring What Matters: Architecture Quality Metrics for Safety-Critical Software
When people talk about software quality in safety-critical systems, the conversation usually gravitates toward testing — coverage percentages, review checklists, static analysis tool outputs. These are all necessary. But there is a layer that often goes unmeasured: the quality of the architecture itself.
An architecture can pass every code review and still accumulate structural problems that make the system fragile, hard to change, and risky to extend. This post is about a project I have been working on — building a metrics system to track architectural quality over time, inspired by ISO 26262 requirements for automotive software.
The Problem with “Good Enough”
In large embedded systems, software architecture tends to grow organically. New components get added, interfaces get extended, and responsibilities blur. At some point, someone asks: is our architecture still in good shape? — and nobody has a clear answer.
The challenge is not that people do not care. It is that architectural quality is difficult to observe. You can run a test suite and get a pass/fail result. You cannot run a test suite on your component dependency graph and get a meaningful score.
What you need is a defined set of metrics, applied consistently, at fixed points in time.
Three Levels of Measurement
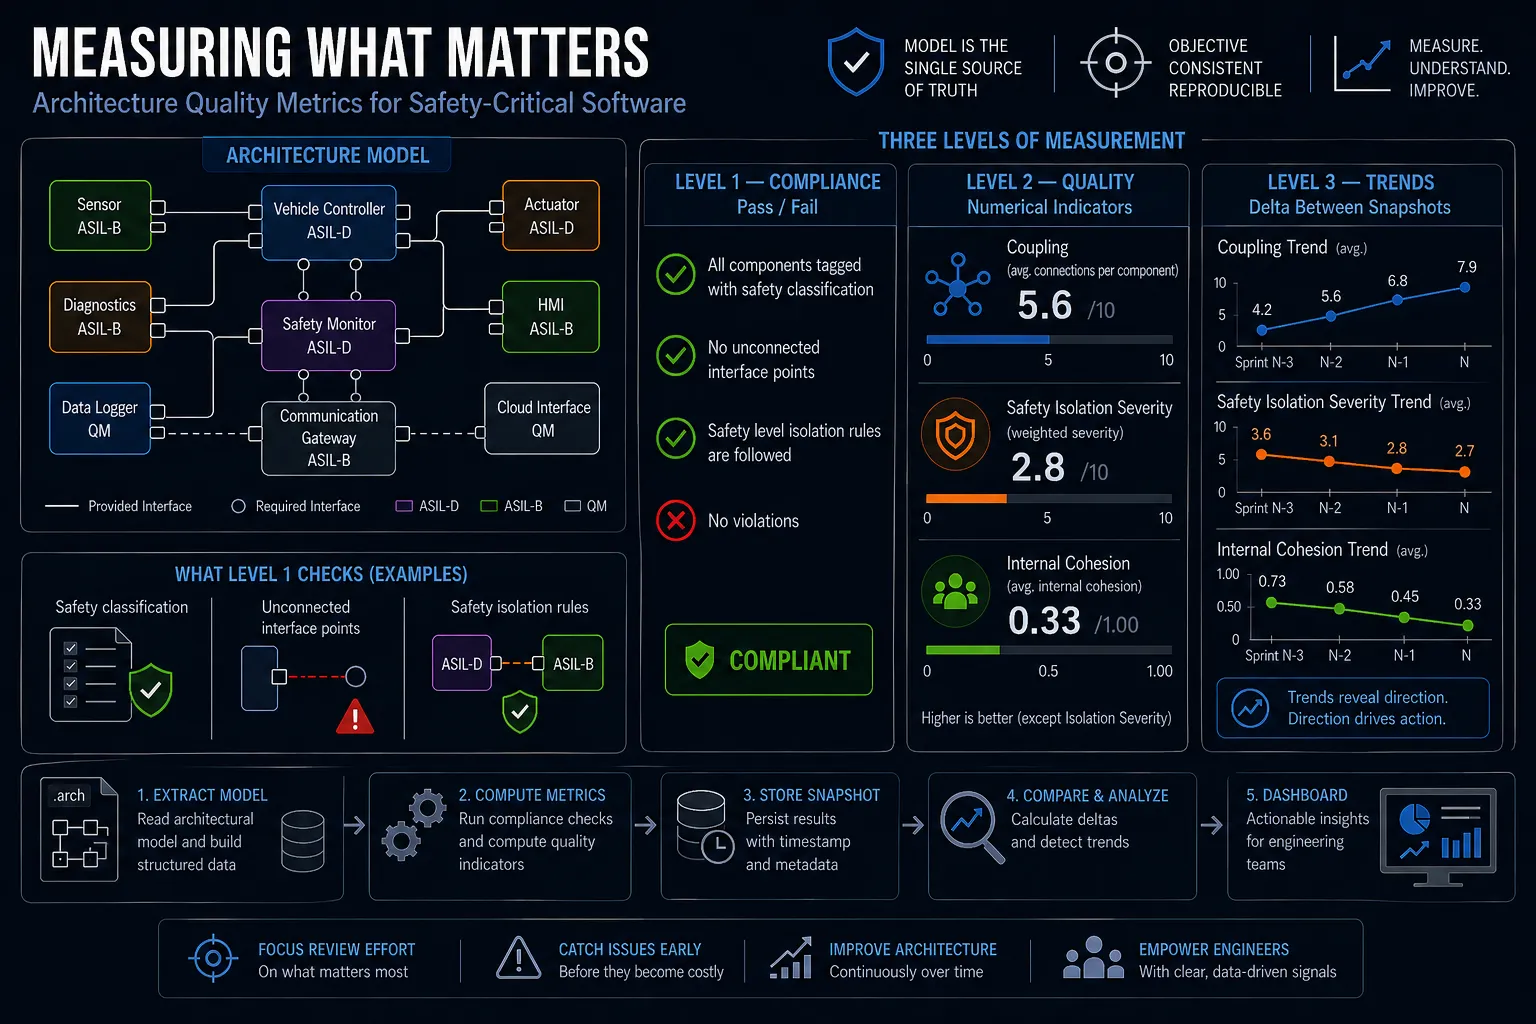
The approach I have been developing structures metrics into three levels, each serving a different purpose.
Level 1 — Compliance (Pass / Fail)
The first level is a hard gate. These are binary checks: either the architecture satisfies a rule, or it does not. A single failure here means the model is non-compliant, regardless of how well it scores elsewhere.
Examples of what this level checks:
- Are all components properly tagged with their safety classification?
- Are there any unconnected interface points — components that declare an interface but connect to nothing?
- Do the safety levels of communicating components follow the isolation rules required by ISO 26262?
If any of these fail, you stop. There is no point computing quality scores on a non-compliant foundation.
Level 2 — Quality (Numerical Indicators)
Once compliance is confirmed, the second level measures the degree of quality. These are not pass/fail — they produce numbers that you can compare across time.
Three indicators I find most valuable:
Coupling — how tightly connected is each component to the rest of the system? A component with too many connections becomes an architectural hub: a single point of failure, a bottleneck for change. Too few connections might signal an orphaned or incomplete component. The goal is a balanced, well-distributed dependency graph.
Safety isolation severity — even in a compliant architecture, some connections might be technically allowed but still carry elevated risk. This metric measures the degree of safety-level mismatch across connections, giving a weighted severity score rather than a binary answer.
Internal cohesion — do the internal execution units of a component actually belong together? A component whose internal parts share no common interfaces is often doing too many unrelated things and is a candidate for decomposition. This is easier to spot with a metric than in a code review.
Level 3 — Trends (Delta Between Snapshots)
The third level is time. A single measurement tells you where you are. A series of measurements tells you where you are going.
By taking model snapshots at fixed checkpoints — end of sprint, end of release cycle — you can track whether quality is improving or deteriorating. Are new compliance violations being introduced? Is coupling increasing as the system grows? Is unresolved technical debt accumulating faster than it is being resolved?
Trend data is often more actionable than absolute scores. A coupling score of 6 is not inherently good or bad. A coupling score that has increased from 4 to 6 to 8 over three checkpoints is a warning sign.
Why Automate This
The honest answer is that manual architectural reviews do not scale. By the time a system has dozens or hundreds of components, no reviewer can hold the full dependency graph in their head. Automated metrics do not replace judgment — they direct it. Instead of asking is the architecture OK?, you ask which components need attention this sprint?
A key design principle: every metric in this system is derived exclusively from the architectural model itself. There are no external data sources, no manual spreadsheets, no third-party feeds. The model is the single source of truth. This means the metrics are reproducible, consistent, and free from the ambiguity that comes from mixing data origins.
The output of this system is not a certification document. It is a dashboard for the team: a consistent, objective signal about the health of the architecture over time.
What Is Next
The first implementation milestone is extraction — reading the architectural model and producing structured data that the metrics engine can consume. Once that is in place, the metrics themselves can be computed, stored, and compared.
The interesting work will come after the first real measurement run: calibrating thresholds against actual data, understanding which metrics correlate with real problems, and making the output genuinely useful to the engineers working on the system day to day.
More on that when we get there.
This project is in active development. Feedback welcome.